3 billion users strong, Facebook is growing year over year in terms of everything, and its ad revenue is, of course, one of them.
If you are someone who is interested in learning more about Facebook Ad revenue through numbers, then you are at the right place.
We have covered interesting facts about how Facebook ads work and how much revenue Facebook make out of their ad revenue.
Without wasting a moment, let’s get into it.
What Is The Facebook Ad Revenue In 2025?
Facebook’s ad revenue contributes significantly to the company’s annual revenue.
As of 2023, Facebook Ad revenue is $202.94 billion, which increased by $17.82 from 2022. Facebook generated $135.94 billion in revenue from its ads in 2022.
In the first quarter of 2023, the number of Facebook users was 3.03 billion, meaning over 37.87% of the world’s population uses Facebook.
With such a huge user base, advertisers have a lot of scope in advertising their products.
Facebook Ad Revenue Over The Years
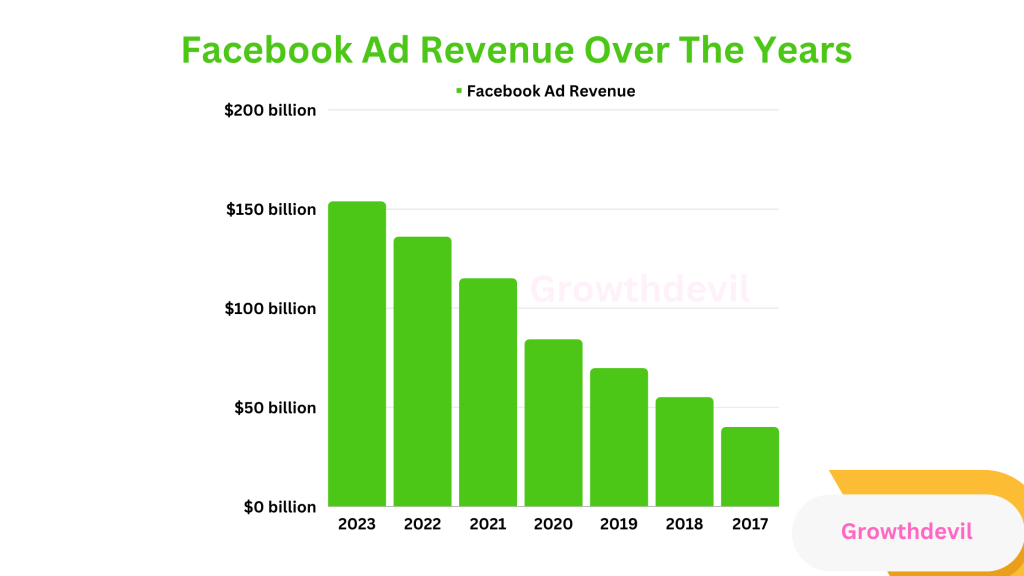
From 2017 to 2023, Facebook Ad revenue increased by $114 billion.

This table shows the Facebook Ad revenue over the years:
| Year | Facebook Ad Revenue |
| 2023 | $153.76 billion |
| 2022 | $135.94 billion |
| 2021 | $114.93 billion |
| 2020 | $84.17 billion |
| 2019 | $69.66 billion |
| 2018 | $55.01 billion |
| 2017 | $39.94 billion |
Source: Statista.
Facebook Ad Revenue From 2023 To 2026 (Projected)
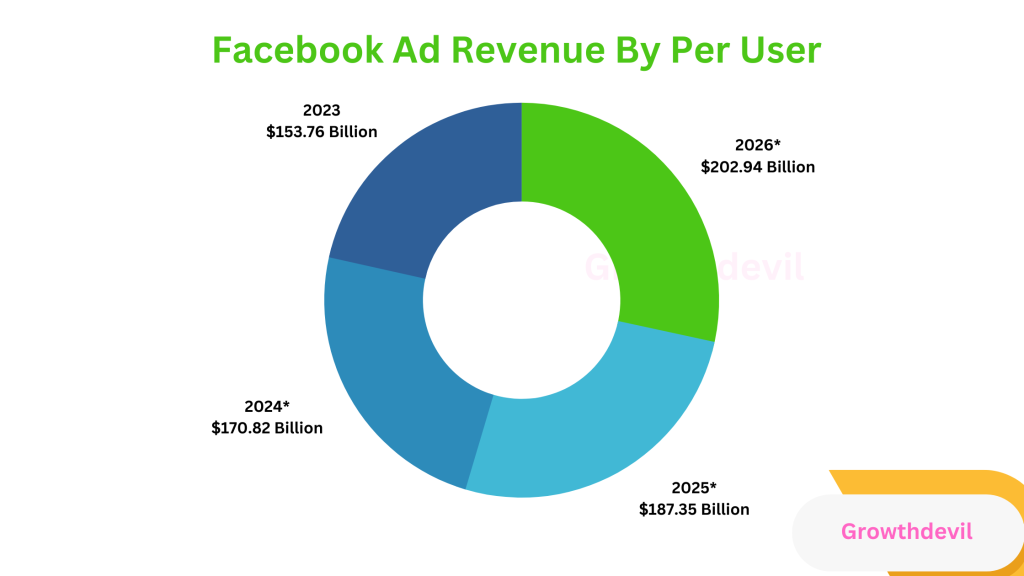
The projected Facebook Ads revenue by the end of 2024 is $170.82 billion, which will be $17.06 billion more than in 2023.

This table shows the projected figures of the Facebook Ad Revenue from 2023 to 2026.
| Year | Facebook Ad Revenue |
| 2026* | $202.94 billion |
| 2025* | $187.35 billion |
| 2024* | $170.82 billion |
| 2023 | $153.76 billion |
*Projected
Source: Statista.
Facebook Ad Revenue By Per User
Facebook Ad revenue per user varies from region to region. Here are some of the essential statistics related to Facebook Ad revenue per user.
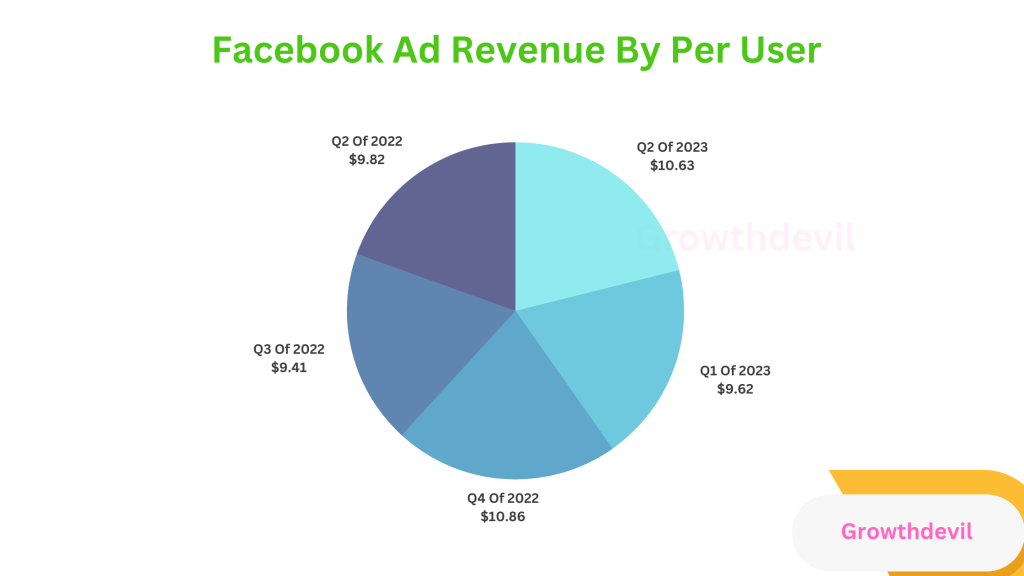
Globally, Facebook’s average revenue per user was $10.63 in the second quarter of 2023, which increased by $1.01 from the first quarter.

This table shows Facebook’s quarterly average revenue per user over the years:
| Quarter | Facebook’s Average Revenue Per User |
| Q2 of 2023 | $10.63 |
| Q1 of 2023 | $9.62 |
| Q4 of 2022 | $10.86 |
| Q3 of 2022 | $9.41 |
| Q2 of 2022 | $9.82 |
Canada and the United States registered the highest average Facebook revenue per user worldwide in the second quarter of 2023, with $53.53.
The largest number of Facebook users is in the region of Asia-Pacific, but the lowest Facebook ad revenue per user comes from this region.
The Asia-Pacific region experienced $4.88 ARPU.
This table shows Facebook’s average revenue per user by region:
| Region | Facebook’s Average Revenue Per User |
| Canada and The United States | $53.53 |
| Europe | $17.88 |
| Asia-Pacific | $4.88 |
| Worldwide | $10.63 |
Source: Oberlo.
Conclusion: Facebook Ad Revenue (2025)
Facebook is not just a popular social media platform; it has the highest potential ad audiences.
And with all the predictions pointing towards an increase in ad revenue, Facebook isn’t optional if you are a marketer.
I hope this article served you well with Facebook’s ad revenue figures. Check out more of our statistical posts for more information.
FAQs
Meta generated $121.9 billion in advertising revenue as of 2023, and it is projected that it will generate $134.72 billion in advertising revenue by 2024.
Google Search and Google Network combined generated $224.47 billion in advertising revenue in 2022. The second top revenue generators were Facebook and Instagram, generating $113.64 billion in advertising revenue combined.
In 2022, Meta’s average revenue per employee was $1,535,056, which decreased slightly in 2022 than in 2021.
58.5% of Meta’s revenue came from Facebook. While the remaining 41.5% of revenue came from Instagram.
- Shopify 3 Months For $1 (DEC 2025) – 90 Days Trial - October 3, 2025
- Helium 10 Free Trial (2025) — Access Premium Features - September 4, 2025
- Jungle Scout Free Trial (2025) — Get 7 Days Access Now - September 4, 2025


