Marketers can reach a 1.628 billion advertising audience on Instagram.
Instagram generates a significant share of Meta’s revenue. Over 41.49% of Meta’s revenue comes from Instagram.
If you are a marketer planning to promote your brand on Instagram, then this article is essential for you.
We have compiled figures related to Instagram Ad revenue and its audience in this post.
Let’s have a look at it.
How Much Revenue Does Instagram Generate From Ads Worldwide?
Instagram generates most of its revenue from Ads. Instagram generated $50.58 billion in Ad revenue worldwide, which was $7.3 billion more than the last year.
In 2020, Instagram Ad revenue was $28.08 billion, which will reach $59.61 billion in 2025.
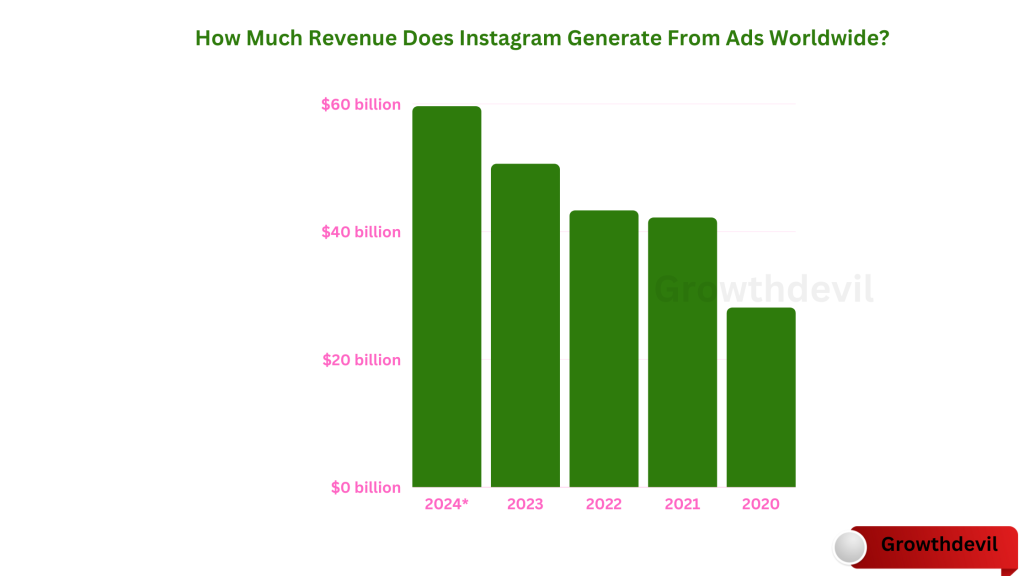
This table shows the Instagram Ad revenue worldwide.
| Year | Instagram Ad Revenue |
| 2024 | $59.61 billion |
| 2023 | $50.58 billion |
| 2022 | $43.28 billion |
| 2021 | $42.18 billion |
| 2020 | $28.08 billion |
Instagram’s Ad revenue growth rate was the highest in 2021 from 2020 to 2023. Instagram revenue experienced a growth of over 50% from 2020 to 2021.
The ad revenue of Instagram increased by 80.1% from 2020 to 2023. And it is set to increase by 17.9% from 2023 to 2024.
This table shows the Instagram Ad revenue growth.
| Year | Instagram Ad Revenue Growth Rate |
| 2024 | 17.9% |
| 2023 | 16.9% |
| 2022 | 2.6% |
| 2021 | 50.2% |
| 2020 | – |
Instagram launched its popular story feature in August 2016. Soon, the Instagram story feature became popular among users. Today, it is one of the vital contributors to Instagram Ad revenue.
The share of In-feed ad revenue is more than Instagram stories Ads. As of 2023, the share of Instagram stories Ads revenue is 26.70%, which means the in-feed ad revenue share is 73.30%.
Source: eMarketers, Oberlo.
How Much Does Instagram Generate From Ads In The United States?
The United States has the second-highest number of Instagram Ad audiences.
The United States generated 78.48% of Instagram Ad revenue, which means only 21.52% of revenue comes from other parts of the world.
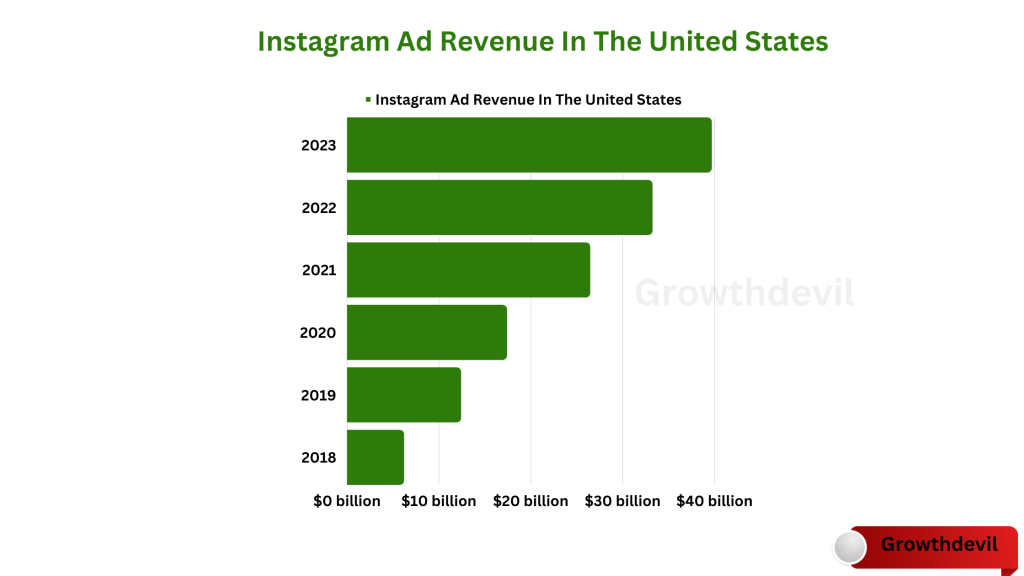
Instagram generated $39.70 billion in Ad revenue in the United States, which was $6.45 billion more than the last year.
This table shows the Instagram Ad revenue in the United States.
| Year | Instagram Ad Revenue In The United States |
| 2023 | $39.70 billion |
| 2022 | $33.25 billion |
| 2021 | $26.46 billion |
| 2020 | $17.40 billion |
| 2019 | $12.40 billion |
| 2018 | $6.19 billion |
Instagram Ad revenue grew by 19.4% in the United States from 2022 to 2023, which was the lowest growth rate in the last four years.
This table shows more insights into Instagram Ad revenue growth rate.
| Year | Growth Rate of Instagram Ad Revenue In The United States |
| 2023 | 19.4% |
| 2022 | 25.7% |
| 2021 | 52.1% |
| 2020 | 40.3% |
| 2019 | 109.2% |
| 2018 | – |
Source: Demandsage, Statista.
Share of Instagram And Facebook Revenue In Meta
Meta generated $121.90 million in net Ad revenue. Of these, $50.58 billion comes from Instagram Ad revenue, and $71.32 billion comes from Facebook Ad revenue.
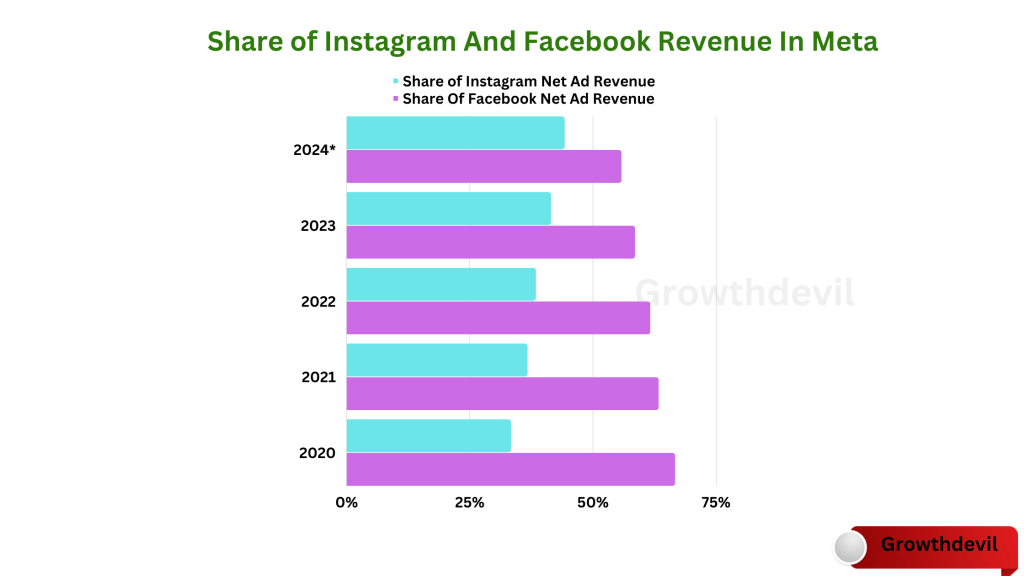
41.49% of Meta’s net ad revenue comes from Instagram as of 2023. And it is expected to grow at 44.24%.
This table shows the net ad revenue percentage for Instagram and Facebook.
| Year | Share of Instagram Net Ad Revenue | Share Of Facebook Net Ad Revenue |
| 2024 | 44.24% | 55.76% |
| 2023 | 41.49% | 58.51% |
| 2022 | 38.40% | 61.60% |
| 2021 | 36.70% | 63.30% |
| 2020 | 33.36% | 66.64% |
If we analyze the table, the share of Instagram’s Net Ad revenue increases yearly. In 2020, Instagram Ad revenue was approximately half of Facebook Ad revenue.
In the future, Instagram can take over Facebook in the Ad revenue.
Source: eMarketers.
How Instagram Got Popularity Among Other Social Media Platforms?
Despite having more share in Meta’s Ad revenue, Facebook’s engagement rate is less than Instagram’s.
According to Adobe Express, Instagram has one of the highest engagement rates among all social media platforms.
Instagram has a 3% user engagement rate, while Facebook has 2%.
If we look at the engagement rate of Instagram’s business accounts, carousel posts have the maximum engagement rate, with 1.26%.
The overall engagement rate of all post types on Instagram is 0.71%.
This table shows the engagement rate of Instagram by post type.
| Post Type | Instagram Engagement Rate |
| All Posts | 0.71% |
| Photo Posts | 0.59% |
| Video Posts | 0.58% |
| Carousel Posts | 1.26% |
Additionally, Instagram stories increased users’ watch time by 7 to 10 minutes. Today, Instagram has over 500 million Instagram story users.
Moreover, Instagram is the top choice of micro-influencers. The below image shows the important content formats that are effective for influencer marketing.
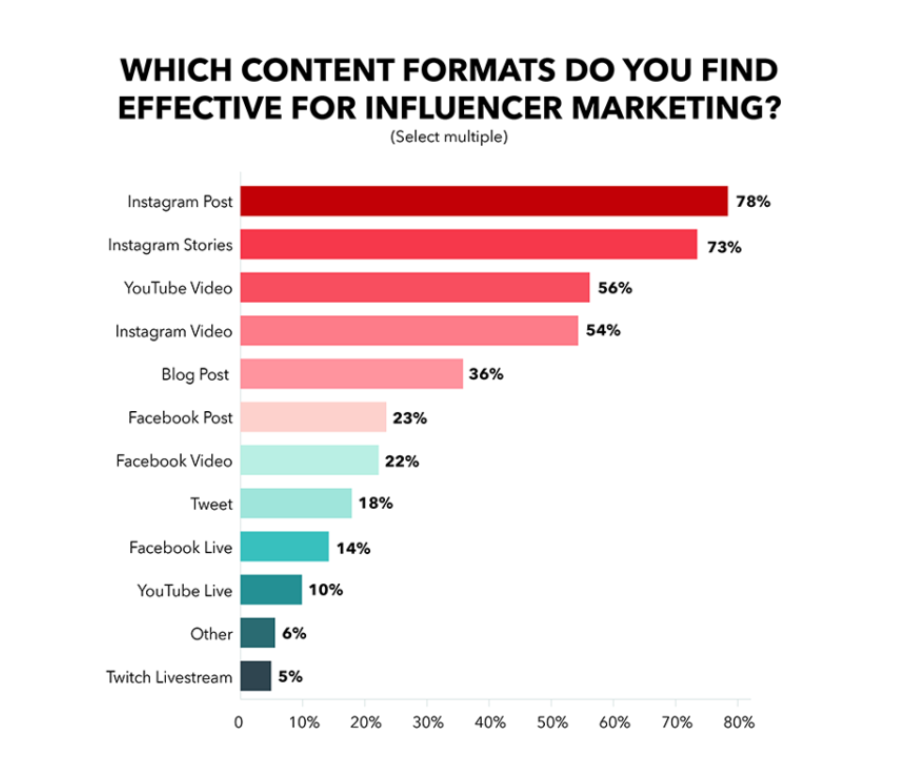
78% of micro-influencers responded that Instagram posts are most effective for engaging audiences, while 73% said Instagram Stories.
We can say that due to the massive pool of mobile app users, maximum brand reach, boosting engagement rate, driving higher conversion, etc., Instagram become popular among other social media platforms.
Source: Demandsage.
Instagram Ad Audience Statistics
Let’s look at all the essential statistics related to the demographic of Instagram’s ad audience.
Instagram’s ad audience makes up 20.3% of the world’s population. And 31.4% of the internet users are Instagram’s Ad audience.
India is the biggest market for Instagram. The largest number of Instagram’s Ad audiences are in India, with 326.6 million users. The United States holds the second place, with 168.6 million users.
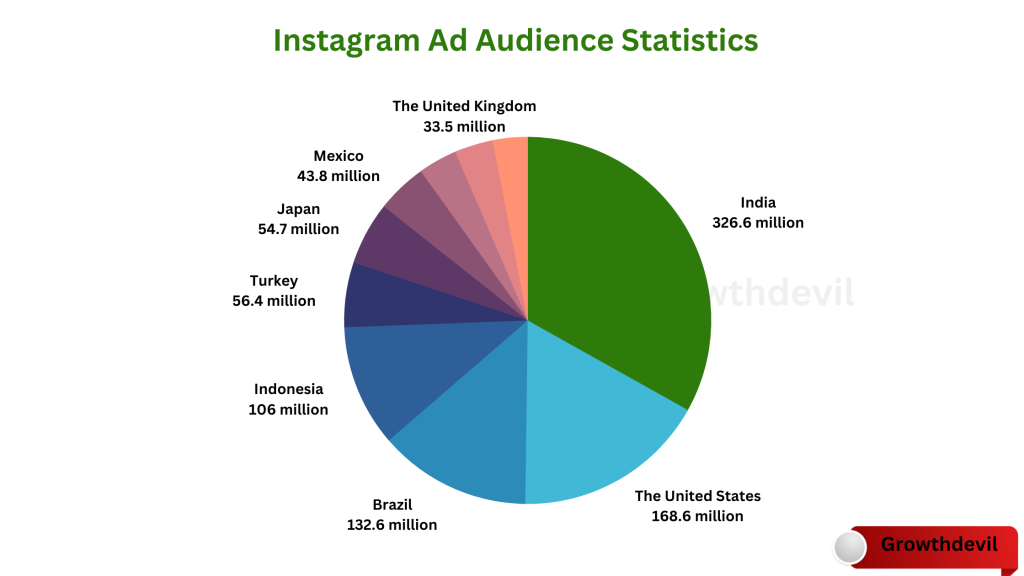
Despite being the top country by the number of Instagram Ad audiences, India has an adult ad reach rate of 28.9%.
This table shows the top countries by Instagram Ad Audience.
| Top Country | The Number of Instagram Ad Audiences |
| India | 326.6 million |
| The United States | 168.6 million |
| Brazil | 132.6 million |
| Indonesia | 106 million |
| Turkey | 56.4 million |
| Japan | 54.7 million |
| Mexico | 43.8 million |
| Germany | 33.8 million |
| The United Kingdom | 33.5 million |
| Italy | 30.3 million |
If we look at the Instagram Ad audience by region, then Southern Asia has the maximum number of Ad audiences, with 354.2 million.
The second top region is Southern America, with 224.5 million ad audiences.
This table shows the Instagram Ad audience by region.
| Region | The Number of Instagram Ad Audiences |
| Northern America | 187.2 million |
| Central America | 57.1 million |
| Caribbean | 9.7 million |
| Southern America | 224.5 million |
| Western Europe | 85.2 million |
| Northern Europe | 53.5 million |
| Southern Europe | 76.1 million |
| Eastern Europe | 46.3 million |
| Northern Africa | 45.4 million |
| Western Africa | 17.6 million |
| Middle Africa | 2.4 million |
| Eastern Africa | 11.1 million |
| Southern Africa | 7.4 million |
| Western Asia | 127 million |
| Central Asia | 24.3 million |
| Southern Asia | 354.2 million |
| Southeastern Asia | 183.2 million |
| Eastern Asia | 98.8 million |
| Oceania | 16.9 million |
More than half of the Instagram Ad audiences are males, they make up 50.6% of all Instagram Ad audiences. On the other hand, females make up 49.4% of Instagram’s ad audiences.
Moreover, most Instagram ad audiences fall under the age group of 18 to 24 years. 32% of Instagram Ad audiences are from this group, accounting for 131.1 million users.
More than 65-year-old Instagram Ad audiences only comprise 2.6% of total users, while they account for 41.5 million users.
This table shows the Instagram Ad audiences by age group.
| Age Group | Share of Instagram Ad Audiences | Number of Instagram Ad Audiences |
| 13 to 17 years | 8.1% | 131.1 million |
| 18 to 24 years | 32% | 517.7 million |
| 25 to 34 years | 29.6% | 488.7 million |
| 35 to 44 years | 15.3% | 246.3 million |
| 45 to 54 years | 8.2% | 132.2 million |
| 55 to 64 years | 4.2% | 68.2 million |
| More than 65 years | 2.6% | 41.5 million |
If we break down Instagram ad audience by age and gender, only in the two age groups, male ad audiences are more than Female. These age groups are 18 to 24 years and 25 to 34.
This table shows the Instagram Ad audiences by age and gender.
| Age Group | Male Ad Audience | Female Ad Audience |
| 13 to 17 years | 4.1% | 4.1% |
| 18 to 24 years | 16.7% | 15.3% |
| 25 to 34 years | 15.7% | 13.9% |
| 35 to 44 years | 7.4% | 7.9% |
| 45 to 54 years | 3.6% | 4.6% |
| 55 to 64 years | 1.7% | 2.5% |
| More than 65 years | 1.1% | 1.5% |
Of the total male Instagram ad audiences, 137.56 million male audiences are between the age group of 18 and 24 years old. At the same time, 2 million females fall under this age group.
This table shows the number of Instagram ad Audiences by age and gender.
| Age Group | Number of Male Ad Audience | Number of Female Ad Audience |
| 13 to 17 years | 33.77 million | 32.97 million |
| 18 to 24 years | 137.56 million | 123.04 million |
| 25 to 34 years | 129.33 million | 111.78 million |
| 35 to 44 years | 60.95 million | 63.53 million |
| 45 to 54 years | 29.65 million | 36.99 million |
| 55 to 64 years | 14 million | 20.10 million |
| More than 65 years | 9.06 million | 12.06 million |
Globally, the adult ad reach rate of Instagram is 26.6%. In the United States, this rate is significantly more than the global rate, which is 60.10%.
Instagram’s most adult ad reach is in Bahrain, with 91.2%.
This table shows the top countries and territories with the most adult ad reach rate on Instagram.
| Top Country | Adult Ad Reach on Instagram |
| Bahrain | 91.2% |
| Kazakhstan | 89.6% |
| Brunei | 86.5% |
| Cyprus | 85.9% |
| Cayman Islands | 83.9% |
| Turkey | 84.7% |
| The United Arab Emirates | 83.5% |
| Kuwait | 82.8% |
| Uruguay | 81.7% |
| Chile | 80.2% |
| Guam | 77.8% |
| Montenegro | 77.7% |
| Panama | 78% |
| Argentina | 76.8% |
| Brazil | 75.4% |
Source: Data Reportal.
Conclusion: Instagram Ad Revenue In 2025
The share of Instagram Ad revenue is rapidly increasing in Meta’s ad revenue. By 2025, Instagram Ad revenue will surpass Facebook Ad revenue.
The engagement rate of Instagram can be the biggest player in your marketing strategy because Instagram has one of the highest engagement rates among social media platforms.
I hope you have found this article helpful for your brand’s marketing. We will be updating this article as we get our hands on new facts and figures. Meanwhile, Happy Instagramming!
FAQs
Meta generated $31.5 billion in advertising revenue in the second quarter of 2023, 12% more than in the second quarter of 2022.
Meta’s $50.58 billion Ad revenue comes from Instagram’s Ad revenue, and $71.32 billion comes from Facebook’s Ad revenue, which means Facebook’s Ad revenue is more than Instagram’s. However, Instagram Ad revenue is anticipated to surpass Facebook Ad revenue by 2025.
An Instagram influencer with 1 million followers called Mega-influencers, their earnings for sponsored posts range from $5,000 to $25,000.
Instagram pays $0.01 to $0.05 everywhere in the world. This amount may look less, but it can accumulate a large amount for creators with many followers.
Epidemic Sound Survey’s findings say TikTok is the top social media platform that pays the most to its creators. YouTube is closely behind TikTok.
- Shopify 3 Months For $1 (DEC 2025) – 90 Days Trial - October 3, 2025
- Helium 10 Free Trial (2025) — Access Premium Features - September 4, 2025
- Jungle Scout Free Trial (2025) — Get 7 Days Access Now - September 4, 2025

