Amazon Prime is one of Amazon’s most successful subscription services, and it is responsible for approximately 17% of Amazon’s revenue.
The multiple benefits under one subscription at an affordable price are the primary drivers of Amazon Prime’s success.
In this article, I have compiled the most influential statistics revolving around Amazon Prime revenue, users, and Amazon services.
Amazon Prime Statistics: Top Picks (2025)
Dive into the world of Amazon Prime with insightful statistics, revealing its impact, growth, and significance in the e-commerce landscape.
- 230 million people are subscribed to Amazon Prime.
- Amazon Prime generated over $44.37 billion in revenue.
- Amazon has a 22% share of video streaming platforms in the United States.
- Amazon Prime Video is projected to have 250 million subscribers by 2027.
- The United States has 185 million Amazon Prime members.
- Over 82.20 million people use Amazon Prime Music globally.
- More than 200 million items were sold on the Amazon Prime Day Sale.
Amazon Prime Revenue Statistics
- Amazon Prime generated around $44.37 billion in revenue.
- Amazon Prime subscription service amassed $35.22 billion in revenue in 2022.
- Amazon Prime’s revenue increased by 109.98% between 2019 and 2023.
Amazon generated approximately $574.9 billion in revenue, which means Amazon Prime’s total share of Amazon’s revenue was 14% during that time.
Here is a table showing Amazon Prime’s revenue over the years:
| Year | Amazon Prime Revenue |
| 2024 | $44.37 billion |
| 2023 | $40.2 billion |
| 2022 | $35.22 billion |
| 2021 | $31.77 billion |
| 2020 | $25.21 billion |
| 2019 | $19.21 billion |
| 2018 | $14.17 billion |
| 2017 | $9.72 billion |
| 2016 | $6.39 billion |
| 2015 | $4.47 billion |
| 2014 | $2.76 billion |
Source: Statista
Amazon Prime Video Statistics
Amazon Prime Video is one of Amazon’s most popular services. In this section, let’s see all the vital statistics related to Amazon Prime Video.
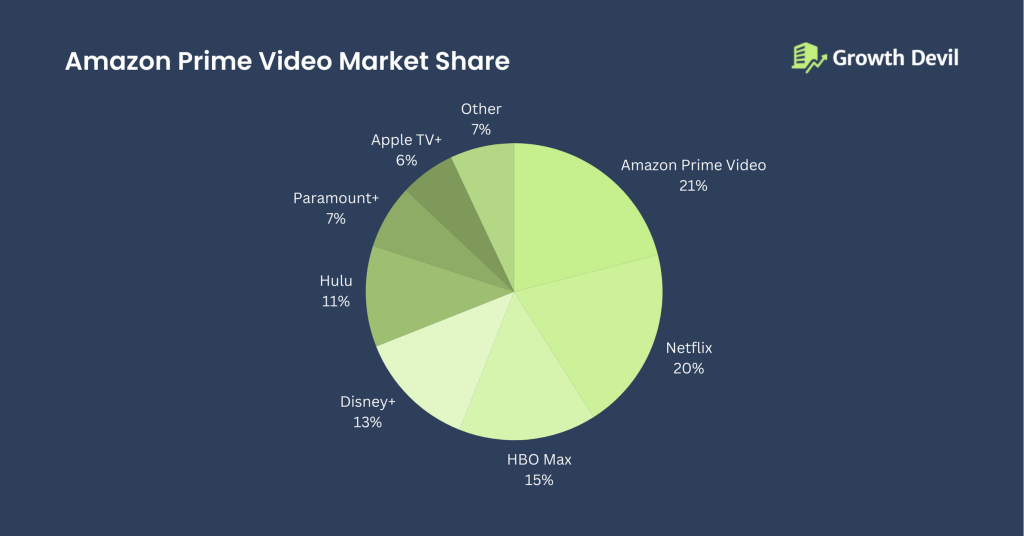
- Amazon holds a 22% share of video streaming platforms in the United States.
Here is a table with the market share of subscription video-on-demand (SVOD) services in the United States:
We have already seen Amazon Prime Video, which is the largest streaming service, based on its number of subscribers.
At the same time, Amazon Prime Video is the second-largest streaming service by market share.
With Amazon Prime Video increasingly investing in exclusive concerts and K-pop content to drive user engagement, it’s clear how global music sensations like BTS have influenced streaming behavior. The BTS concert viewership surge exemplifies the power of fandom culture—where millions tune in live, crash servers, and push subscriptions upward within hours. These events are shaping how platforms measure success and allocate future content budgets.
This table shows the top video streaming services by market share.

| Video Streaming Service | Market Share |
| Amazon Prime Video | 22% |
| Netflix | 20% |
| HBO Max | 15% |
| Disney+ | 13% |
| Hulu | 11% |
| Paramount+ | 7% |
| Apple TV+ | 6% |
| Other | 7% |
Source: Statista
5. Amazon Prime Video spent around $50 per user on content in 2023.
6. Amazon Prime Video generated $14.6 billion in revenue in 2023.
This table shows Amazon Prime Video revenue over the years.
| Year | Amazon Prime Video Revenue |
| 2022 | $5.16 billion |
| 2021 | $4.63 billion |
| 2020 | $4.10 billion |
| 2019 | $3.57 billion |
7. 21.55% of traffic on Amazon Prime Video comes from India.
8. Amazon Prime Video is expected to have 250 million subscribers by 2027.
Source: Statista
Most Amazon Prime members are in the United States, but most Amazon Prime Video traffic comes from India.
India is closely followed by Brazil and Canada, with 11.76% and 7.21%, respectively.
This table shows the traffic of Amazon Prime Video by top country.
| Top Country | Share Of Amazon Prime Video Traffic |
| India | 21.55% |
| Brazil | 11.76% |
| Canada | 7.21% |
| Spain | 6.93% |
| France | 6.88% |
Source: Semrush
How Many Amazon Prime Users Are There Worldwide?
In this section, let’s explore all the essential statistics related to the number of Amazon Prime Users.
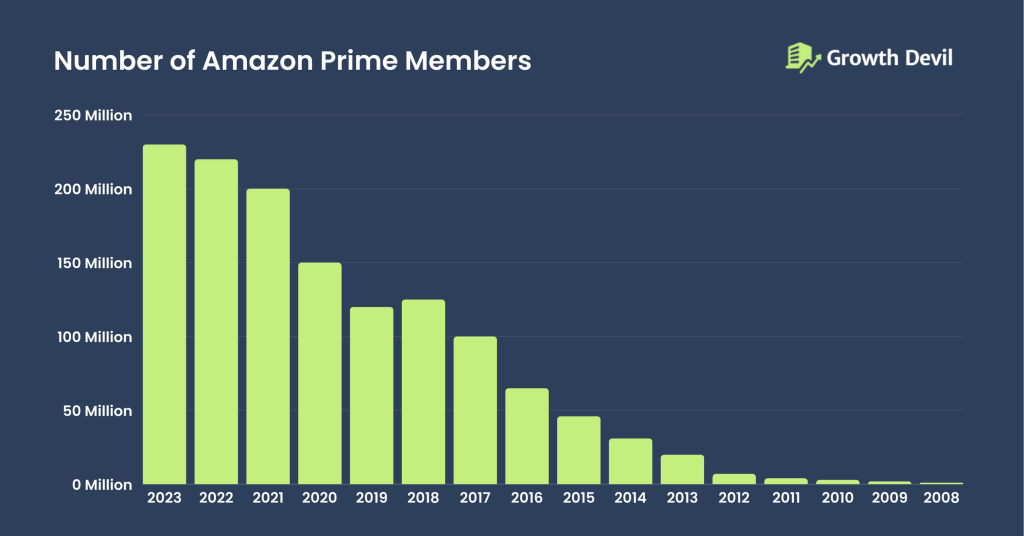
9. 230 million Amazon Prime Members worldwide.
Amazon Prime Members increased by 10% from 2021 to 2022.
This table shows the number of Amazon Prime Members over the years:

| Year | The Number Of Amazon Prime Members |
| 2025 | 260 Million (Projected) |
| 2024 | 240 Million |
| 2023 | 230 million |
| 2022 | 220 million |
| 2021 | 200 million |
| 2020 | 150 million |
| 2019 | 120 million |
| 2018 | 125 million |
| 2017 | 100 million |
| 2016 | 65 million |
| 2015 | 46 million |
| 2014 | 31 million |
| 2013 | 20 million |
| 2012 | 7 million |
| 2011 | 4 million |
| 2010 | 3 million |
| 2009 | 2 million |
| 2008 | 1 million |
Source: Yaguara, Tech Jury.
How Many Amazon Prime Users Are In The United States?
10. In 2025, there will be more than 185 million Amazon Prime users in the United States.
63% of the population in the United States are members of Amazon Prime as of 2024.
This table shows the number of Amazon Prime Members over the years.
| Year | The Number Of Amazon Prime Members |
| 2025 | 185 million |
| 2024 | 180.10 million |
| 2023 | 174.90 million |
| 2022 | 168.30 million |
| 2021 | 161.70 million |
| 2020 | 146.10 million |
| 2019 | 126 million |
| 2018 | 112.10 million |
| 2017 | 99.70 million |
| 2016 | 65 million |
| 2015 | 54 million |
| 2014 | 40 million |
| 2013 | 25 million |
Source: Statista.
What Is The Demography Of Amazon Prime Users?
Let’s look at all the vital statistics related to the demographic of Amazon Prime users.
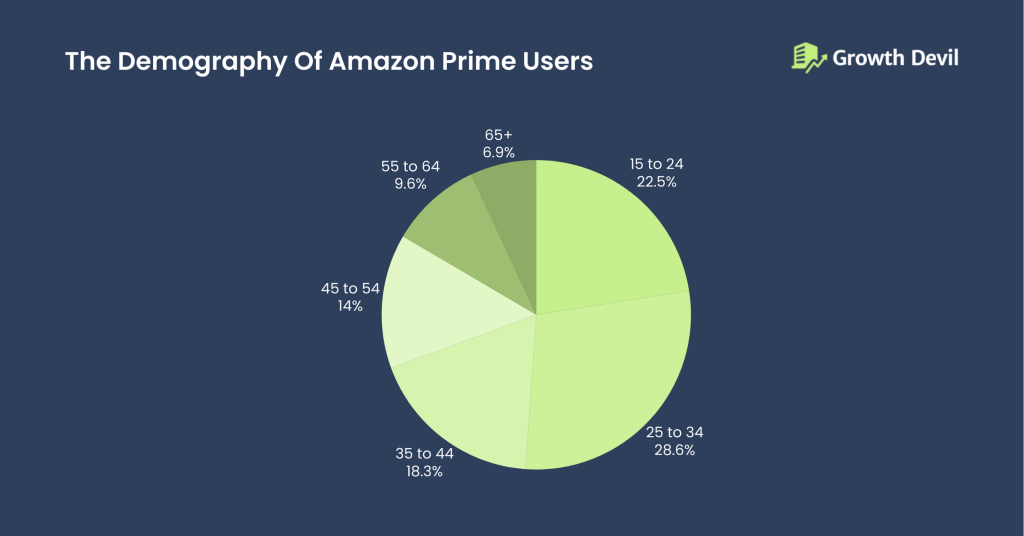
11. 28.61% of Amazon Prime members fall under the age group of 25 to 34 years old.
This age group has the most Amazon Prime Members, accounting for over 62.92 million members.
The second largest age group by the number of Amazon Prime Members is between 15 to 24 years, which accounts for over 49.54 million members.
This table shows the Amazon Prime Members by age group.

| Age Group | The Share Of Amazon Prime Users |
| 15 to 24 | 22.52% |
| 25 to 34 | 28.61% |
| 35 to 44 | 18.28% |
| 45 to 54 | 14.04% |
| 55 to 64 | 9.63% |
| More than 65 years | 6.92% |
12. 80.3% of the Millennials in the United States are familiar with Amazon Prime.
There are 318.66 million internet users in the United States. Of these internet users, almost 7 out of 10 users have Amazon Prime Members.
This table shows the share of Amazon Prime Users in the total internet users in the United States by age group.
| Age Group | Penetration Rate of U.S. Amazon Prime Users |
| Generation Z | 75.2% |
| Millennials | 80.3% |
| Bridge millennials | 82.4% |
| Generation X | 76.2% |
| Baby boomers | 56.6% |
Source: Statista
Amazon Prime Day Statistics
Amazon Prime Day is a sale offering exclusive offers to Amazon Prime Members. Today, Amazon generates multi-billion dollars in sales.
In this section, let’s check out all the essential statistics related to Amazon Prime Day.
13. Amazon Prime Members purchased 200 million items on Amazon Prime Day.
More than 75 million items were purchased on Amazon Prime Day in 2023 compared to 2022.
This table shows the number of items purchased on Amazon Prime Day.
| Year | The Number of Items Purchased During Amazon Prime Day |
| 2024 | 200 million |
| 2023 | 375 million |
| 2022 | 300 million |
| 2021 | 250 million |
| 2019 | 175 million |
| 2018 | 100 million |
14. Amazon Prime Day sales generated over $14.2 billion.
In 2015, just 0.9 billion gross sales were generated from Amazon Prime Day. Just in 6 years, these gross sales reached $10.4 billion.
This table shows the gross sales of Amazon Prime Day.
| Year | Amazon Prime Day’s Gross Sales |
| 2024 | $14.2 billion |
| 2023 | $12.9 billion |
| 2022 | $12 billion |
| 2021 | $11.2 billion |
| 2020 | $10.4 billion |
| 2019 | $7.16 billion |
| 2018 | $4.19 billion |
| 2017 | $2.41 billion |
| 2016 | $1.52 billion |
| 2015 | $0.90 billion |
Source: Statista,
Amazon Prime Music Statistics
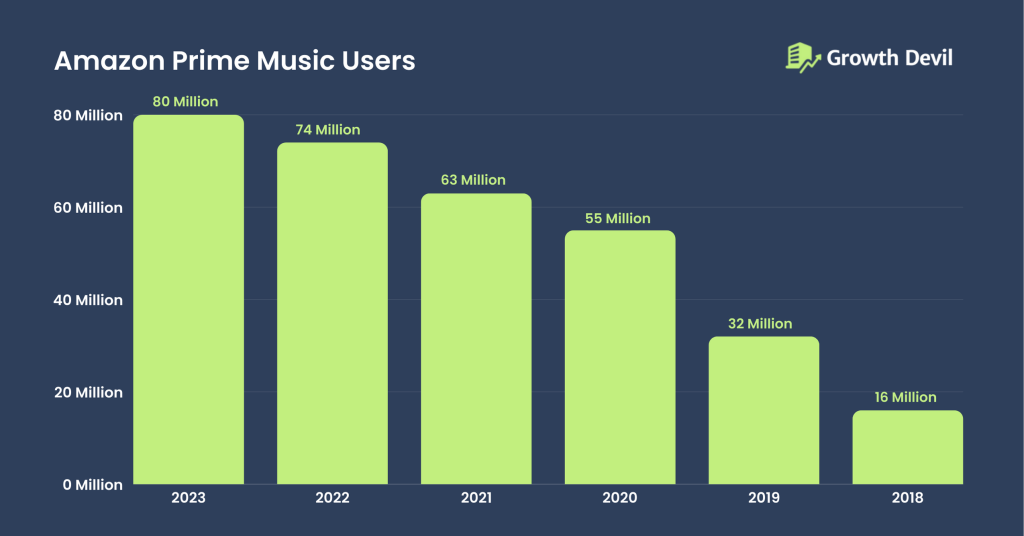
15. There are 82.20 million Amazon Prime Music users worldwide.
Amazon Prime Music is one of the top music streaming services worldwide.
10 million Amazon Prime Music users increased in 2022 compared to the previous year.
This table shows the Amazon Prime Music Users.

| Year | Amazon Prime Music Users |
| 2023 | 80 million |
| 2022 | 74 million |
| 2021 | 63 million |
| 2020 | 55 million |
| 2019 | 32 million |
| 2018 | 16 million |
Source: Business Of Apps
16. 82 million Amazon Prime Music listeners are in the United States.
The United States is the top country in terms of the number of Amazon Prime Music users. 63.99% of Amazon Prime Music users were in the United States in 2022.
This table shows the number of Amazon Prime Music users in the United States.
| Year | The Number of Amazon Prime Users |
| 2024 | 82 million |
| 2023 | 78.9 million |
| 2022 | 52.60 million |
| 2021 | 48.10 million |
| 2020 | 42.20 million |
| 2019 | 36.30 million |
| 2018 | 30.40 million |
| 2017 | 24.50 million |
17. Amazon Prime Music has 8.2% of the music streaming service market share in 2024.
Amazon Prime Music’s share increased by 0.3% compared to the previous year.
This table shows the market share of Amazon Prime Music.
| Year | Market Share of Amazon Prime Music |
| 2024 | 8.2% |
| 2023 | 11.1% |
| 2022 | 13.3% |
| 2021 | 13% |
| 2020 | 11% |
| 2019 | 13% |
18. 9 million Users visited Amazon Prime Music in January 2024.
This table shows Amazon Prime Music’s monthly visitors from May 2023 to July 2023.
| Month | Monthly Visitors |
| November 2023 | 8.7 million |
| December 2023 | 9.5 million |
| January 2024 | 9 million |
19. 91.16% of Amazon Prime Music’s traffic comes from the United States.
We know that most listeners of Amazon Prime Music are in the United States, so the most traffic of Amazon Prime Music also comes from the United States.
This table shows the top countries by Amazon Prime Music Traffic.
| Top Countries | Share Of Traffic |
| The United States | 91.16% |
| Argentina | 0.96% |
| Colombia | 0.65% |
| Germany | 0.53% |
| The United Kingdom | 0.43% |
| Others | 6.27% |
Source: Similarweb
Amazon Statistics
Amazon is the 4th tech company with a $ 2.32 trillion market cap and the 3rd largest company by revenue.
This section will explore some of the essential statistics related to Amazon.
20. In 2023, Amazon generated $574.9 billion in revenue.
This table shows Amazon’s revenue over the years.
| Year | Amazon’s Revenue |
| 2023 | $574.9 billion |
| 2022 | $513.9 billion |
| 2021 | $470.8 billion |
| 2020 | $386 billion |
| 2019 | $280.5 billion |
| 2018 | $232.8 billion |
| 2017 | $177.8 billion |
| 2016 | $135.6 billion |
| 2015 | $107 billion |
21. Globally, Amazon has 310 million customers.
Today, Amazon operates in more than 180 countries and reaches most customers.
Additionally, there are over 9 million Amazon sellers around the world, of which only 1.9 million sellers are active.
22. Home & Kitchen is the number #1 category on Amazon by revenue.
The Home & Kitchen category generated $28.1 billion in revenue in 2022. The second top category is Electronics, which generates $18.7 billion in revenue.
This table shows Amazon’s top categories by revenue.
| Top Category | Revenue |
| Home & Kitchen | $28.10 billion |
| Electronics | $18.70 billion |
| Clothing, Shoes, and Jewelry | $17.10 billion |
| Health & Household | $13.60 billion |
| Tool & Home Improvements | $11.60 billion |
| Sports & Outdoors | $10.30 billion |
| Patio, Lawn & Garden | $10.10 billion |
| Beauty & Personal Care | $9.20 billion |
| Grocery &Gourmet Food | $8.40 billion |
| Toys & Games | $7.5 billion |
Source: Business Of Apps, Influencers Marketing Hub, Similar Web.
Note: If you want to learn more about facts related to Amazon, then check out our post on Amazon statistics here.
General Amazon Prime Statistics
Amazon can ship 100% of households within a day or 1-day shipping in the eight states of the United States; These states are Connecticut, Delaware, the District of Columbia, Florida, New Jersey, Georgia, North Carolina, and South Carolina.
At the same time, 15 states do not get the 1-day shipping in the United States.
This table shows the percentage of households where Amazon can cover same-day or 1-day shipping by state. (excluding the top 8 States, which I mentioned above)
| States | The Percentage Of Households In The US |
| Indiana | 99.9% |
| Rhode Island | 99.9% |
| Virginia | 99.9% |
| New Hampshire | 99.9% |
| Massachusetts | 99.6% |
| Maryland | 98.2% |
| Arizona | 95.7% |
| Texas | 95.3% |
| California | 94.6% |
| Pennsylvania | 88.9% |
| Oregano | 86.8% |
| Minnesota | 74% |
| Wisconsin | 72.3% |
| Illinois | 72% |
| Nevada | 71.3% |
| Washington | 70.6% |
| New York | 66.9% |
| Ohio | 66.3% |
Source: CNBC.
Related Read:
- How to Sell on Amazon For Beginners
- How To Make Money On Amazon
- Abandoned Cart Statistics
- Online Shopping Statistics
Conclusion: Amazon Prime Has A User Base Of Over 260 Million
In addition to its e-commerce dominance, Amazon has acquired an impressive user base of over 260 million Amazon Prime users in a pretty short time.
Due to the increasing usage of digital services globally, Amazon Prime is expected to rise notably in the coming years.
These were the most impactful statistics focused on Amazon Prime revenue and subscribers.
FAQs
In 2023, nearly 71% of Amazon users were Amazon Prime users.
As per historical data, the Amazon Prime Day Sale is usually held in July. In 2023 and 2022, the Amazon Prime Day Sale was live on the 11th and 12th of July.
The United States is the top country in terms of Amazon Prime usage. It has the most number of Amazon Prime users.
Amazon Prime Membership starts from $14.99 per month in the United States. The yearly Amazon Prime plan begins at $139.
- Shopify 3 Months For $1 (DEC 2025) – 90 Days Trial - October 3, 2025
- Helium 10 Free Trial (2025) — Access Premium Features - September 4, 2025
- Jungle Scout Free Trial (2025) — Get 7 Days Access Now - September 4, 2025

