There are around 2.64 billion online shoppers in 2024. With an increase in online shopping habits, sales took a leap too.
With a growth rate of 52% for the near future, the sales are expected to cross multiple trillions.
In this article, I have compiled everything related to e-commerce growth to help you understand the e-commerce market completely.
Without wasting time, let’s look into it, shall we?
eCommerce Growth Statistics (Top Picks)
Exploring E-Commerce Growth Unveiling Key Statistics and Trends Shaping the Future of Online Retail for Businesses and Consumers Alike.
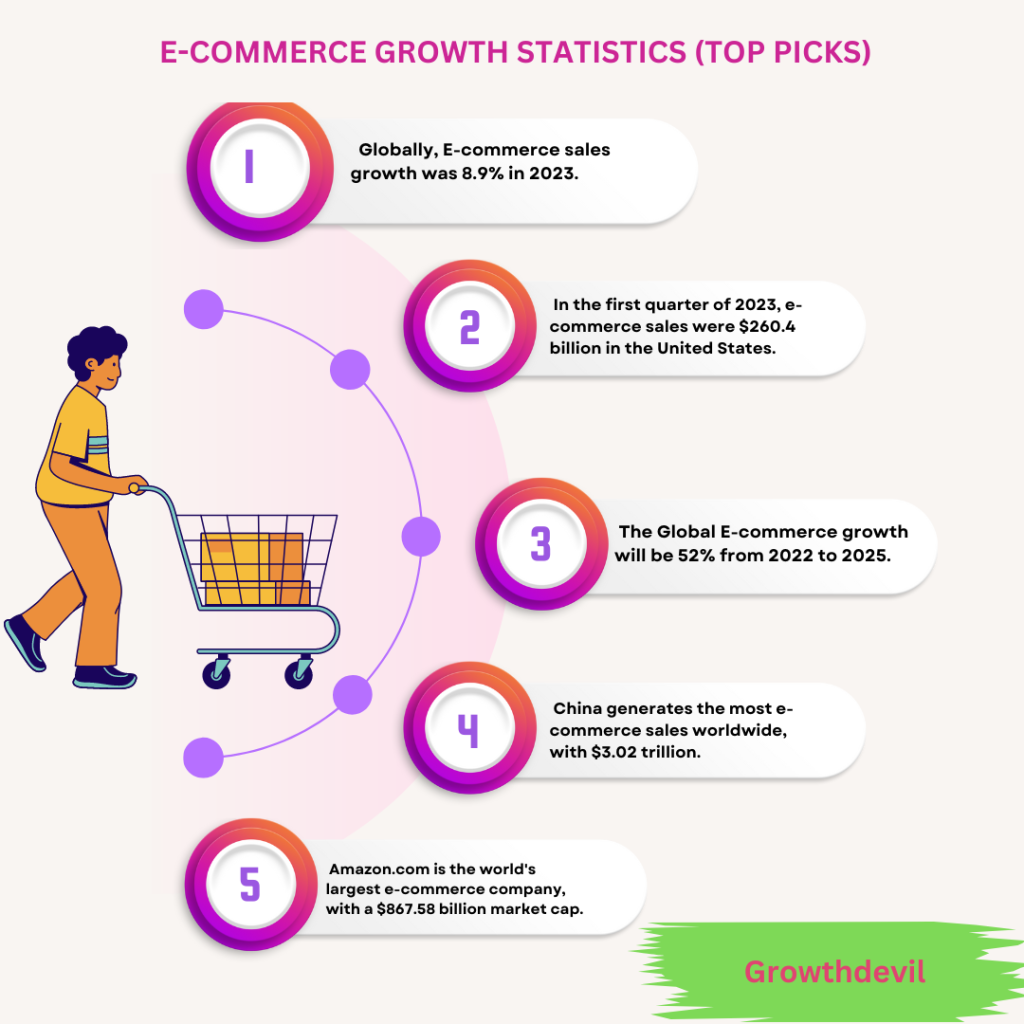
- Globally, E-commerce sales growth was 8.9% in 2023.
- In the first quarter of 2023, e-commerce sales were $260.4 billion in the United States.
- The Global E-commerce growth will be 52% from 2022 to 2025. (Excluding The United States, Europe, and China)
- China generates the most e-commerce sales worldwide, with $3.02 trillion.
- Amazon.com is the world’s largest e-commerce company, with a $867.58 billion market cap.
Note: Unlock the latest e-commerce stats here and stay ahead in online business here.
Global eCommerce Growth Statistics
In this article, we will explore some essential statistics related to global e-commerce growth, which will help you to understand the global e-commerce scenario.
- Globally, E-commerce sales growth is 8.9% in 2023.
The E-commerce industry has been booming with an 8.9% growth rate, and global e-commerce sales reached $5.8 trillion in 2023.
Global E-commerce is expected to grow by an average of 8.62% from 2023 to 2027.
The global e-commerce growth will be the most in 2024, with 9.4%.
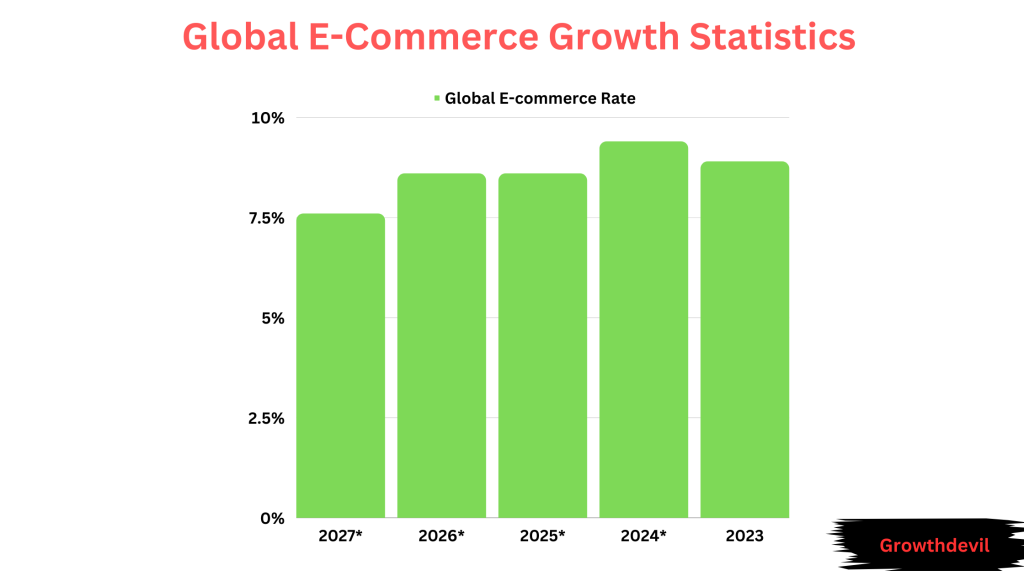
This table shows the global e-commerce sales growth from 2023 to 2027.
| Year | Global E-commerce Rate |
| 2027* | 7.6% |
| 2026* | 8.6% |
| 2025* | 8.6% |
| 2024* | 9.4% |
| 2023 | 8.9% |
- Global e-commerce sales are expected to reach $8 trillion by 2027.
We have just seen that global e-commerce sales reached $5.8 trillion, with 8.9% over-year-over growth as of 2023.
Industry experts anticipated that global e-commerce sales would hit $6.3 trillion by the end of the next year.
This table shows the global e-commerce sales from 2023 to 2027.
| Year | The Global E-Commerce Sales |
| 2027* | $8 trillion |
| 2026* | $7.5 trillion |
| 2025* | $6.9 trillion |
| 2024* | $6.3 trillion |
| 2023 | $5.8 trillion |
Source: Oberlo, Shopify.
eCommerce Growth In The United States Statistics
The United States is one of the leading e-commerce markets in the world.
Let’s get some vital statistics about e-commerce growth in the United States.
- In the first quarter of 2023, e-commerce sales were $260.4 billion in the United States.
The United States is one of the largest E-commerce markets worldwide. The E-commerce industry is the fastest-growing industry in the United States.
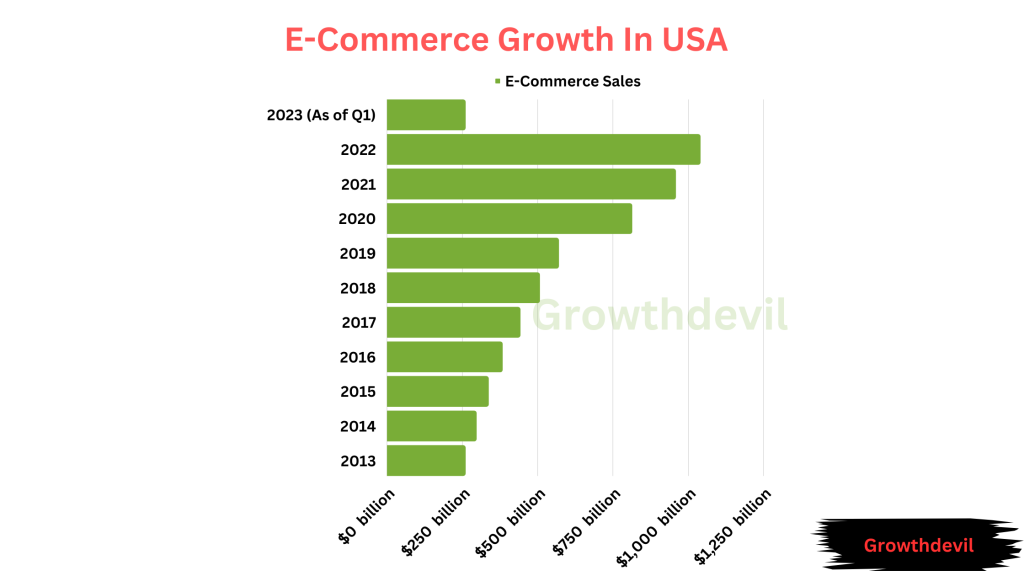
In 2022, e-commerce sales in the United States were $1.03 trillion.
This table shows the e-commerce sales in the United States from 2013 to 2023.
| Year | E-Commerce Sales |
| 2023 (As of Q1) | $260.4 billion |
| 2022 | $1,039.70 billion |
| 2021 | $958 billion |
| 2020 | $813.10 billion |
| 2019 | $569.90 billion |
| 2018 | $506.80 billion |
| 2017 | $442.20 billion |
| 2016 | $383.20 billion |
| 2015 | $337 billion |
| 2014 | $296.80 billion |
| 2013 | $260.40 billion |
Source: Oberlo.
eCommerce Growth By Region
Some of the world’s regions are experiencing more than 50% of e-commerce growth. It is important to know the e-commerce growth rates by region.
In this section, let’s see which region has the most scope to grow your e-commerce business.
- The Global E-commerce growth will be 52% from 2022 to 2025. (Excluding The United States, Europe, and China)
The United States is experiencing the fastest e-commerce growth worldwide, with 50%.
The second-top region that experiences the fastest growth is Europe, with 47%.
This table shows the e-commerce sales growth by region.
| Region | E-Commerce Sales Growth |
| The United States | 50% |
| Europe | 47% |
| China | 15% |
| Rest of The World | 52% |
Source: Oberlo.
eCommerce Growth And Sales By Country
Some countries are experiencing the most e-commerce growth rate, while some are generating the most e-commerce sales.
In this section, let’s get detailed insights into e-commerce growth and sales by country.
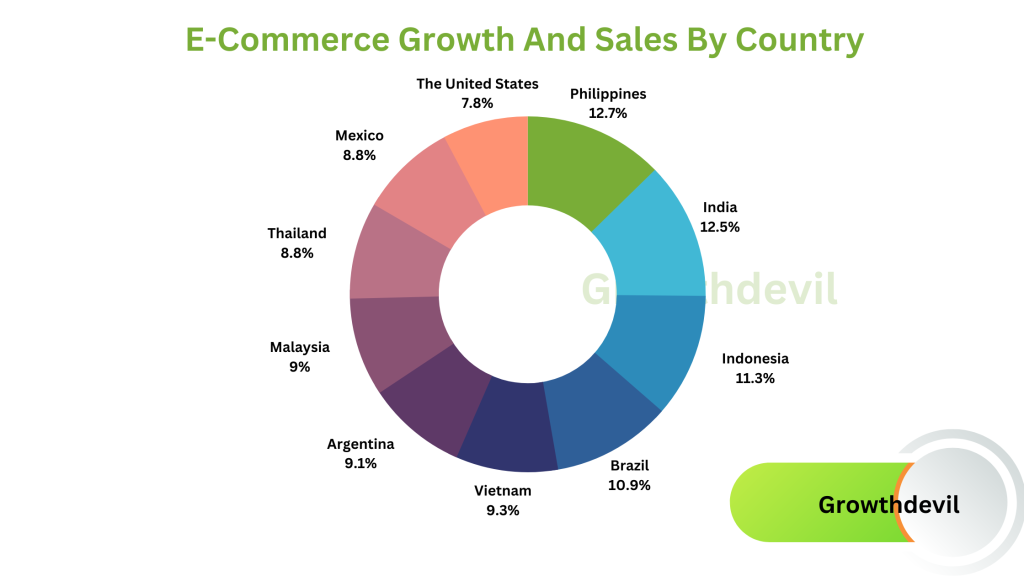
- The Philippines is the fastest-growing e-commerce market, growing by 25.9% of year-over-year growth.
Digital developments are exploding in Asia; due to this, the fastest-growing top 3 countries in e-commerce are from Asia.
The second-top country is India, with a 25.5% growth rate.
This table shows the top 10 fastest-growing countries in e-commerce by growth rate.
| Top Countries | Growth Rate |
| Philippines | 25.9% |
| India | 25.5% |
| Indonesia | 23% |
| Brazil | 22.2% |
| Vietnam | 19% |
| Argentina | 18.6% |
| Malaysia | 18.3% |
| Thailand | 18% |
| Mexico | 18% |
| The United States | 15.9% |
- China generates the most e-commerce sales worldwide, with $3.02 trillion.
China had 845.29 million online shoppers in 2022, which means 33% of online shoppers are located in China.
Every three shoppers out of 10 are from China. Due to this, most e-commerce sales are generated in China.
The second most e-commerce sales-generating country is the United States, with $1.16 trillion.
This table shows the e-commerce sales by top country.
| Top Country | E-Commerce Sales |
| China | $3,023.66 billion |
| The United States | $1,163.49 billion |
| The United Kingdom | $195.97 billion |
| Japan | $193.42 billion |
| South Korea | $147.43 billion |
| India | $118.90 billion |
| Germany | $97.32 billion |
| Indonesia | $97.14 billion |
| Canada | $82.81 billion |
| France | $79.36 billion |
Source: Oberlo, Statista.
Top eCommerce Companies By Market Value
There is so much competition in the e-commerce market. This section will explore the statistics about the top e-commerce companies worldwide.
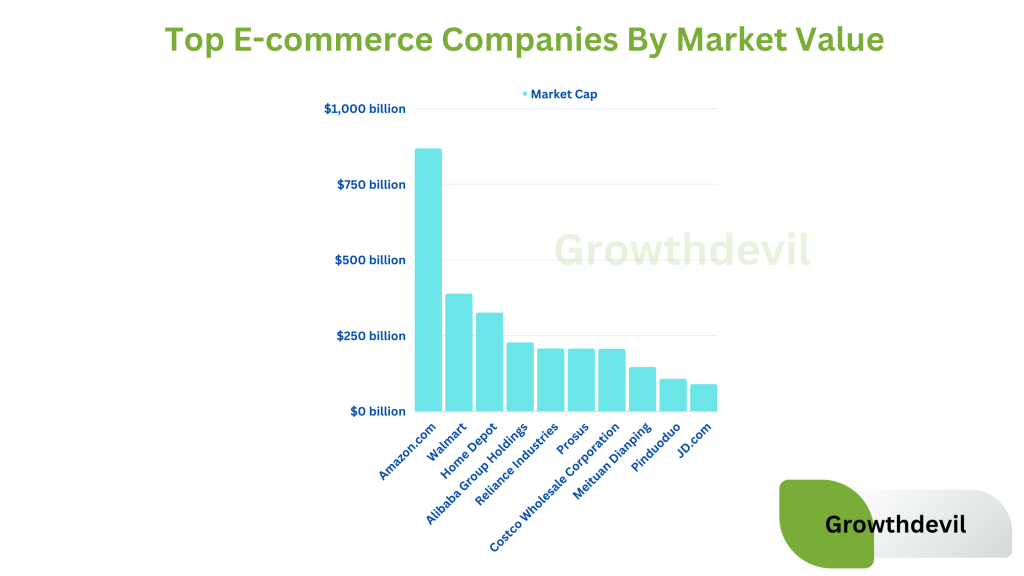
- Amazon.com is the world’s largest e-commerce company, with a $867.58 billion market cap.
The United States and China mainly dominate the top 10 e-commerce companies. 8 out of 10 companies’ headquarters in either of these countries.
Amazon has a vast customer base, with 310 million users. Of these, almost 80% of users are in the United States.
Amazon’s market cap is doubled that of its closest competitor Walmart. Wlamarket’s market cap is $387.72 billion.
This table shows the top e-commerce companies by market cap.
| Top eCommerce Companies | Market Cap |
| Amazon.com | $867.58 billion |
| Walmart | $387.72 billion |
| Home Depot | $324.85 billion |
| Alibaba Group Holdings | $226.76 billion |
| Reliance Industries | $206.31 billion |
| Prosus | $206.01 billion |
| Costco Wholesale Corporation | $205.34 billion |
| Meituan Dianping | $145.31 billion |
| Pinduoduo | $106.25 billion |
| JD.com | $88.36 billion |
- Amazon’s market share in the e-commerce industry is 37.8%.
As we know, Amazon is the leading e-commerce company in the world by market cap. However, it is the top e-commerce company by their market share.
Amazon’s top competitor Walmart is not even close to Amazon by market share. Walmart’s market share is 6.3%.
This table shows the top 15 e-commerce companies by their market share.
| Top eCommerce Company | Market Share |
| Amazon | 37.8% |
| Walmart | 6.3% |
| Apple | 3.9% |
| eBay | 3.5% |
| Target | 2.1% |
| The Home Depot | 2.1% |
| Best Buy | 1.6% |
| Costco | 1.6% |
| Carvana | 1.5% |
| Kroger | 1.4% |
| Wayfair | 1.1% |
| Chewy | 1% |
| Macy’s | 0.9% |
| Lowe’s | 0.9% |
| Qurate Retail Group | 0.7% |
Source: Oberlo, Statista.
Note: If you are interested in learning more about Amazon Statistics, then please refer to this article to get complete insights into Amazon.
Related Read:
Conclusion: eCommerce Growth Statistics (2025)
Many aspects are boosting the e-commerce market, such as increasing internet use, mobile accessibility, and the COVID-19 pandemic.
The projected figures related to e-commerce growth also show that the e-commerce industry will continue to achieve new milestones every year in the future.
If you know some facts and figures related to e-commerce growth or want to add something to the above article, please let me know in the comment section below.
FAQs
218.8 million online shoppers are in the United States as of 2023, which is 4.1 billion more than in 2022.
Food delivery and online grocery are the fastest-growing industries in e-commerce as of 2023. It is driven by changing customer behavior and the global pandemic.
B2B (Business to consumer), B2B (Business to Business), C2B (Consumer to Business), and C2C (Consumers to Consumers are the four types of e-commerce.
Apparel & accessories, electronics, and home appliances are the top e-commerce categories worldwide.
China is the top country in e-commerce. Most of the e-commerce sales come from this country. China generated $3.02 trillion in e-commerce sales as of 2023.
- Shopify 3 Months For $1 (DEC 2025) – 90 Days Trial - October 3, 2025
- Helium 10 Free Trial (2025) — Access Premium Features - September 4, 2025
- Jungle Scout Free Trial (2025) — Get 7 Days Access Now - September 4, 2025

